
Fig. 4.
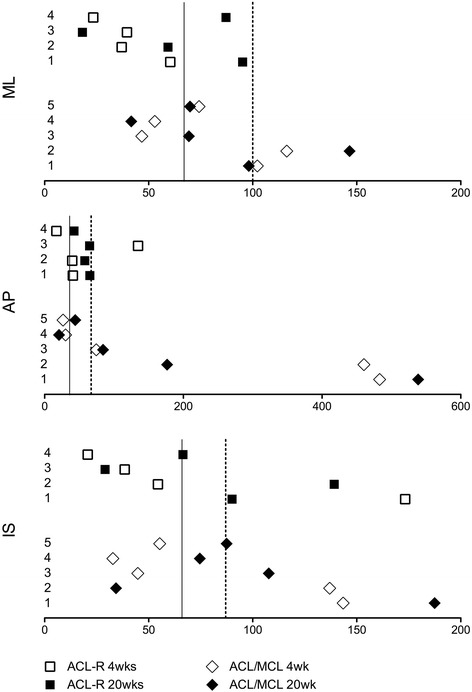
Absolute total change parameter (ACT-P) values for Translations of ACL-R and ACL/MCL Tx animals. Each animal is numbered to correspond to the PCA scatterplots in Fig. 2. Values represent the absolute change from intact at the 4 and 20 week post-surgical time-points in the following DOFs: ML = Medial/Lateral, AP = Anterior/Postieror, IS = Inferior/Superior. Solid line = mean normal control value. Dashed line = 1 standard deviation from normal control mean