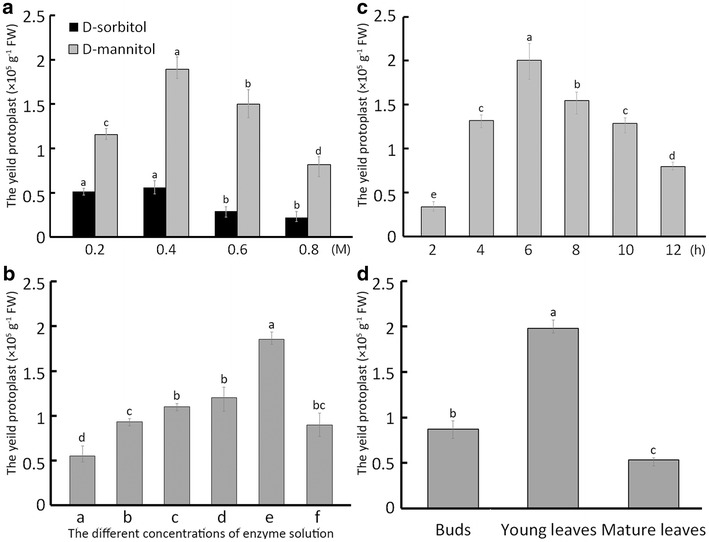
Fig. 2.

The protoplast yield under different treatments. In response to a range (0.2, 0.4, 0.6 and 0.8 M) of mannitol and sorbitol concentrations in digestion solution with 3% Cellulase R10, 0.8% Macerozyme R10, and 0.4% Pectinase (a), protoplast yield as affected by different concentrations of digestion enzymes (b): (a) 1% (w/v) Cellulase R10, 0.4% (w/v) Macerozyme R10, 0.04% (w/v) Pectinase; (b) 1.5% (w/v) Cellulase R10, 0.5% (w/v) Macerozyme R10, 0.04% (w/v) Pectinase; (c) 2% (w/v) Cellulase R10, 0.6% (w/v) Macerozyme R10, 0.04% (w/v) Pectinase; (d) 2.5% (w/v) Cellulase R10, 0.7% (w/v) Macerozyme R10, 0.04% (w/v) Pectinase; (e) 3% (w/v) Cellulase R10, 0.8% (w/v) Macerozyme R10, 0.04% (w/v) Pectinase; (f) 3.5% (w/v) Cellulase R10, 0.9% (w/v) Macerozyme R10, and 0.04% (w/v) Pectinase, protoplast yield as affected by digestion time (2, 4, 6, 8, 10 or 12 h) (c), protoplast yield as affected by tissue type (buds, young leaves and mature leaves) (d)
