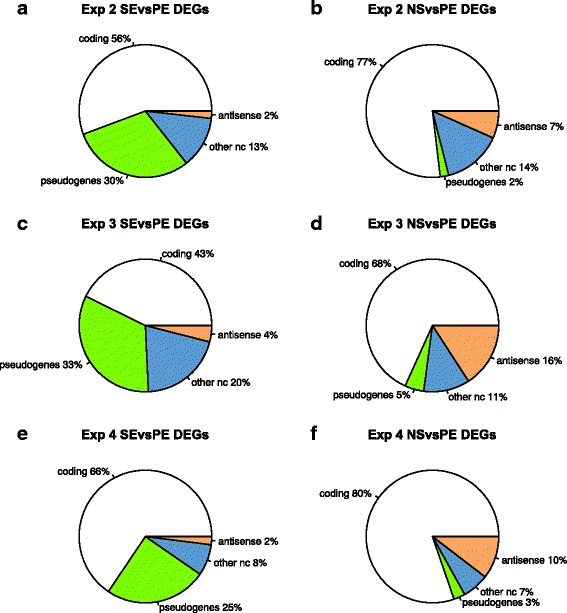
Fig. 4.

Pie charts of differentially expressed genes (DEGs) showing proportion of protein coding and non-protein coding features. The DEGs are classified as: protein coding (white), pseudogenes (green), antisense (orange), non-coding RNAs, other than pseudogenes and antisense (blue). DEGs found in the SE vs PE comparison are in column 1 (a, c, e) and DEGs found in the NS vs PE comparison are in column 2 (b, d, f)
