
Fig. 3.
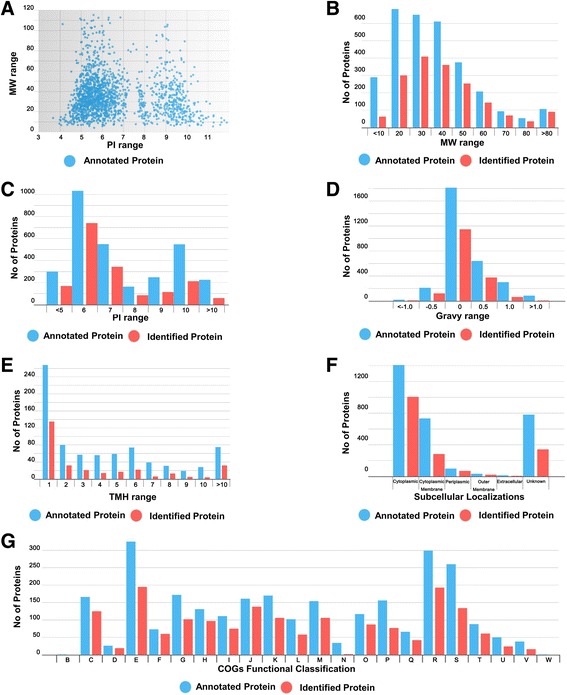
Distribution of the predicted and identified proteins in the B. abortus 104 M genome according to their molecular function. a Distribution of pI values and MW ranges. Distribution of identified protein b MW, c pI, d GRAVY, e TMH, f subcellular localization and g functional classification of proteins identified according to clusters of orthologous groups (COGs). Annotated and identified proteins are shown in blue and red, respectively