
Fig. 4.
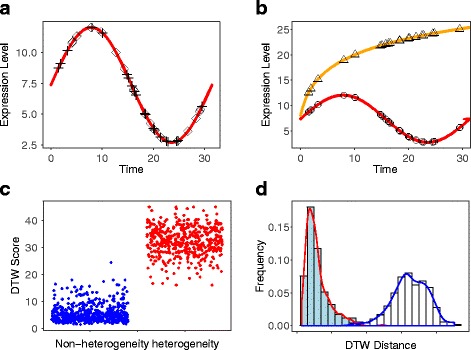
DTWscore identifies heterogeneous and non-heterogeneous genes from the synthetic data. a Temporal patterns of gene expression from a single biological function. Diamonds and crosses shows the time points at which samples were collected from the two time periods. Samples were taken at uneven time intervals. b Temporal patterns of gene expression from two biological functions. Triangles and circles show the time point at which samples were collected from the two time periods. c Jitter plot of DTWscore between non-heterogeneous genes versus heterogeneous genes, displaying clear clusters. d Bins in the horizontal axis summarize changes in the overall expression group of bars corresponding to genes from simulated datasets. Colored bars within each group summarize changes in DTW distance between groups. The figures show that the DTWscore is effective for identifying gene expression patterns