
Fig. 6.
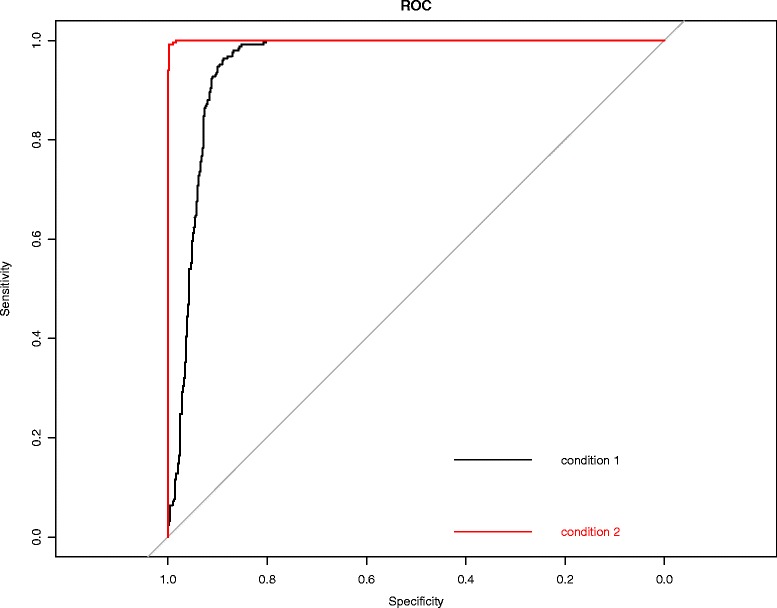
ROC curves from different conditions. The DTWscore method was applied to two different scRNA-seq time series data sets. The algorithm’s performance was assessed by their sensitivity, illustrated in the ROC curves, which demonstrate good performance in all cases. The black curve represents condition 1 simulated by the biological functions f 2(t) and f 3(t). The red curve represents condition 2 simulated by the biological functions f 2(t) and f 4(t)