
Fig. 8.
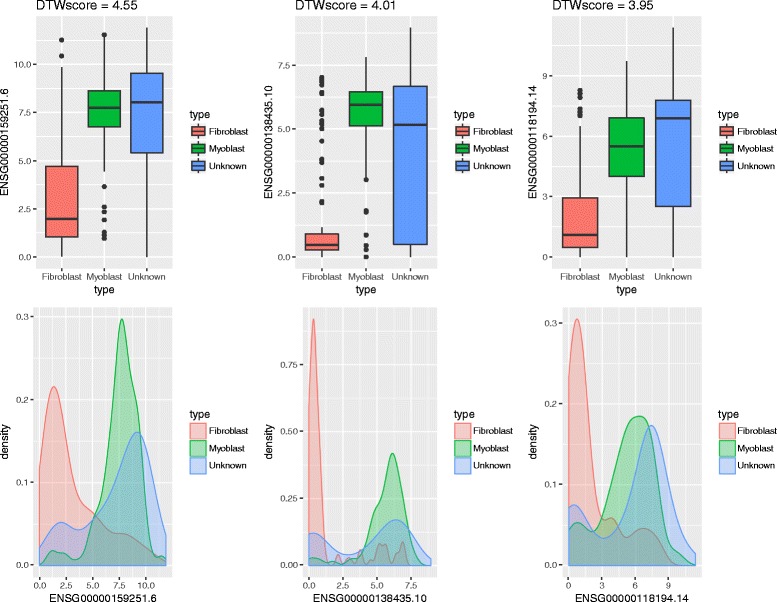
Genes with the top three DTWscores. The boxplot and density represent temporal gene expression values of three highly variable genes from all pairs of cells. It is obvious that these genes should be declared as differentially expressed. The genes with highest DTWscores undergo different expression pattern and play an important role in the following clustering analysis