Figure 2.

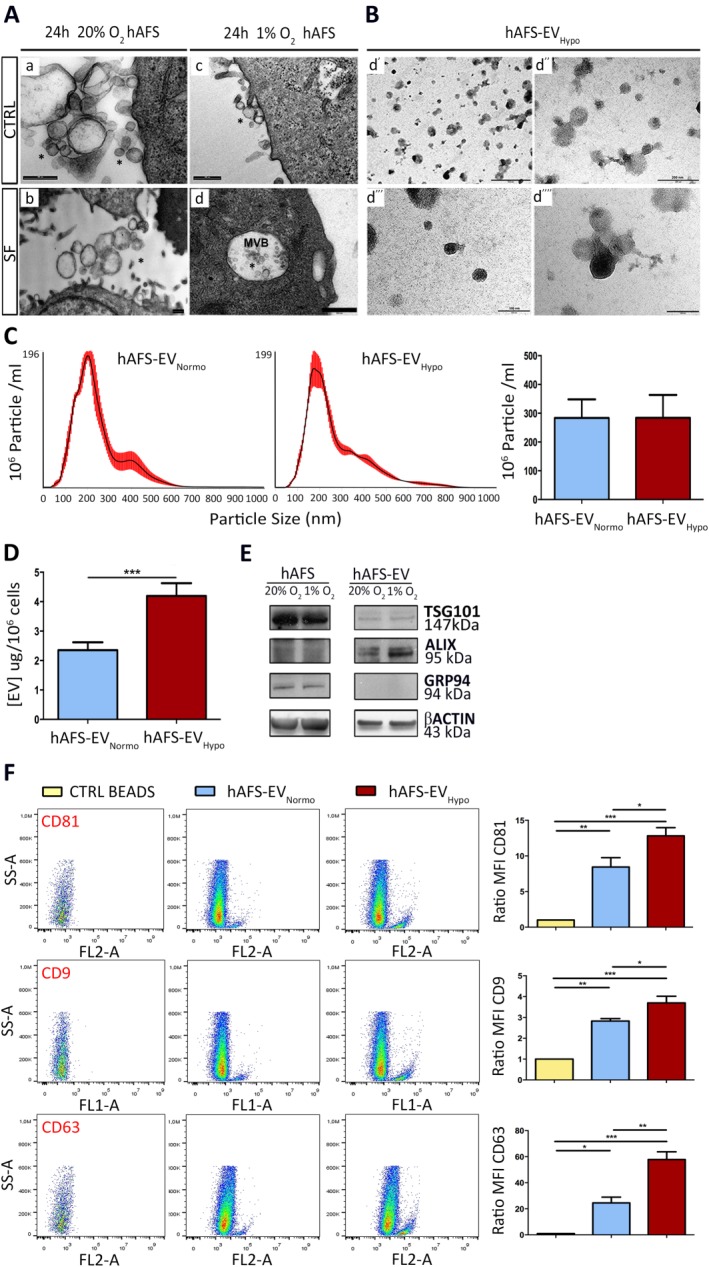
hAFS secrete EV containing microvesicles and exosomes. (A): Transmission electron microscopy (TEM) analysis of hAFS under 24 hours 20% O2 CTRL (a) or 20% O2 SF conditions (b) and 1% O2 CTRL (c) or 1% O2 SF (d) conditions; scale bars 500 nm. (B): TEM Analysis of 1% O2 hAFS‐EV (hAFS‐EVHypo); scale bar 500 nm in (d′); 200 nm in (d′′); and 100 nm (d′′′ and d′′′′). (C): Nanosight analysis measuring the amount of particles within hAFS‐EVNormo (283.3 ± 64.8 × 10⁶ particle/ml) and hAFS‐EVHypo (283.8 ± 79.9 × 10⁶ particle/ml) released by 106 cells (right panel); values are expressed as mean ± SEM. Representative images of the graphical output are reported in the left panel. (D): BCA assay of the protein concentration of hAFS‐EVHypo (4.2 ± 0.4 μg/106 cells, ***, p < .001, p = .0005) over hAFS‐EVNormo (2.4 ± 0.3 μg/106 cells) released by 106 cells. (E): Western Blot analysis of TSG101, ALIX, GRP94, and βACTIN by hAFS and hAFS‐EV, both under 20% O2 and 1% O2 SF conditions. (F): FACS analysis of hAFS‐EVNormo and hAFS‐EVHypo bound to the ExoCapTM Capture Beads compared to control empty beads (CTRL BEADS) for the exosomal markers CD81 (*, p < .05, p = .049; **, p < .01, p = .005; ***, p < .001, p = .0004), CD9 (*p < .05, p = .047; **, p < .01, p = .0015; ***, p < .001, p = .0002), and CD63 (*, p < .05, p = .02; **, p < .01, p = .004; ***, p < .001, p = .0002). Representative dot plots are illustrated in the left panel, the evaluation of the MFI ratio on the right panels. Abbreviations: CD, cluster of differentiation; EV, extracellular vesicles; hAFS, human amniotic fluid stem cells; Hypo, hypoxic; MFI, mean fluorescent intensity; Normo, normoxic; SF, serum‐free.
