Figure 2.

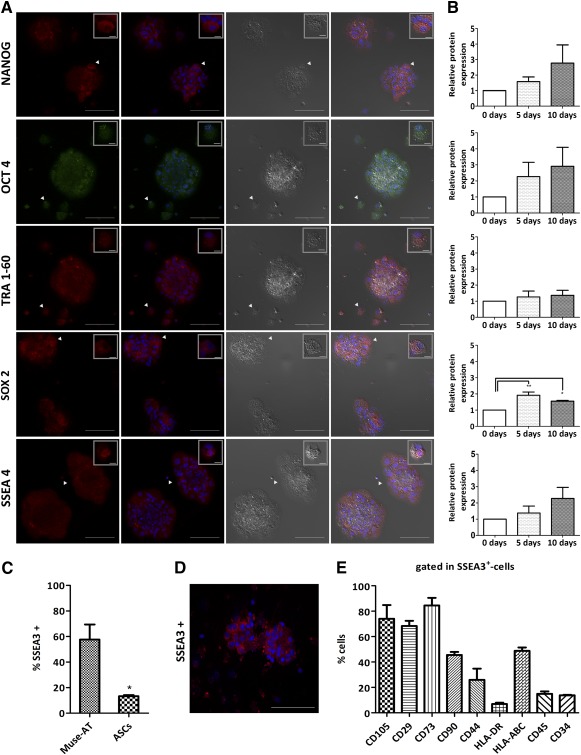
Expression of pluripotency stem cell markers of Muse‐AT cell clusters. (A): Representative immunostaining of the stem cell markers Nanong, OCT4, TRA1‐60, Sox‐2, and SSEA‐4 were observed in almost all Muse‐AT cells in the clusters. Scale bar = 100 µm. White arrowheads indicate single cells shown in upper right insets. Scale bar = 5 µm. (B): Immunofluorescence quantification of stem cell markers. (C): SSEA‐3 was most highly expressed by Muse‐AT cells compared with ASCs, as assessed by fluorescence activated cell sorter (FACS) staining. (D): Immunofluorescence staining confirmed SSEA‐3 expression by Muse‐AT cell clusters. Scale bar = 100 µm. (E): FACS staining of several CDs revealed the immunophenotype of Muse‐AT cells. *, p < .05; **, p < .005; n = 3 samples analyzed. Abbreviations: ASCs, adipose‐derived stromal cells; d, day; Muse‐AT, multilineage‐differentiating stress‐enduring cells derived from adipose tissue; SSEA, stage‐specific embryonic antigen.
