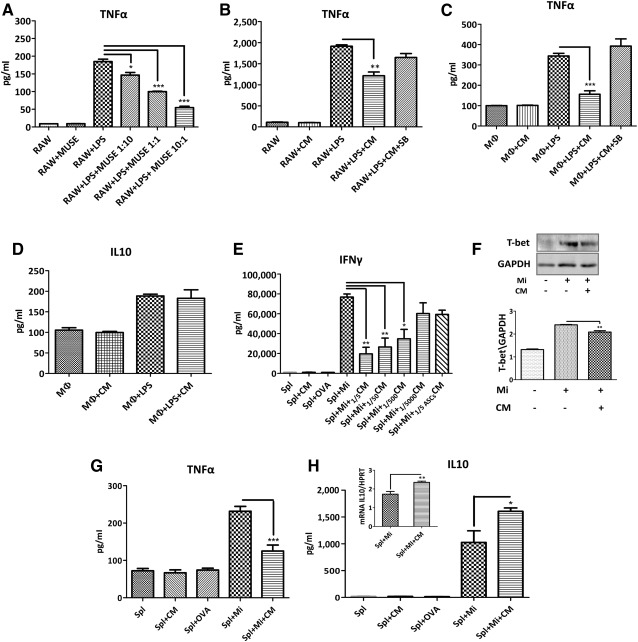
Figure 6.

Muse‐AT cell activity on LPS‐stimulated macrophages and splenocytes. (A): Muse‐AT cells in coculture with the RAW macrophage cell line. RAW cells were seeded onto the lower chamber of a Transwell plate (Corning) and stimulated with LPS for 20 minutes. LPS was removed, the cells washed, and Muse‐AT cells were then cultured (RAW/Muse‐AT in a 1:10; 1:1, and 10:1 ratio) in the upper chamber. (B): Muse‐AT cell CM effects on LPS‐stimulated RAW cells with and without the presence of SB 431542 (SB; 10 ng/ml). (C, D): Freshly isolated murine peritoneal MΦ stimulated with LPS. The effect of Muse‐AT cell CM on the secretion of TNF‐α (C) and IL‐10 (D) was evaluated with and without SB in the culture medium. (E): Antigen‐specific T‐cell response of NOD BDC2.5 splenocytes in culture. Muse‐AT cell CM was assayed at different dilutions (1 to 5 to 1 to 5,000; n = 3). (F): Muse‐AT cell CM downregulated antigen‐stimulated T‐bet expression assessed by Western blot (n = 3). (G): Inhibitory effect on antigen‐challenged T cells on TNF‐α secretion by Muse‐AT cell CM (n = 3). (H): Muse‐AT cell CM enhanced anti‐inflammatory cytokine IL‐10 secretion in antigen‐stimulated T cells (n = 6). The expression levels of mRNA IL‐10 relative to mRNA HPRT are indicated as an inset. Cytokine levels were quantified in 72‐hour culture supernatants by enzyme‐linked immunosorbent assays. OVA was used as a control. Mi concentration = 5 nM. *, p < .05; **, p < .005; ***, p < .0005. Abbreviations: ASCsCM, adipose stem cell conditioned media; CM, conditioned media; GAPDH, glyceraldehyde‐3‐phosphate dehydrogenase; IL, interleukin; LPS, lipopolysaccharide; MΦ, macrophages; Mi, mimotope; Muse‐AT, multilineage‐differentiating stress‐enduring cells derived from adipose tissue; NOD, nonobese diabetic; OVA, ovalbumin; Spl, splenocytes; T‐bet, T‐box transcription factor (TBX21); TNF‐α, tumor necrosis factor‐α.
