
Figure 1.
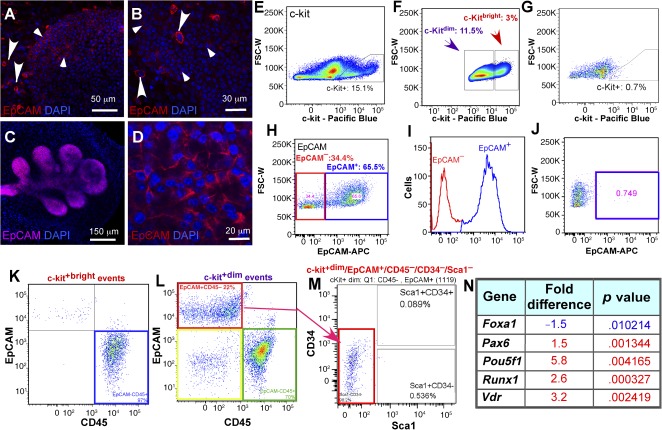
Characterization and isolation of c‐kit‐ and EpCAM‐positive cells. (A, B): c‐kit expression (red) in embryonic (A) and adult (B) lacrimal gland (LG). (C, D): EpCam expression (red) in embryonic (C) and adult (D) LG. Large c‐kit+bright cells are seen in the mesenchyme (large arrowheads) and small c‐kit+dim cells (small arrowheads) in the epithelium (blue indicates DAPI‐stained nuclei). (E–G): Flow cytometric profile of freshly isolated c‐kit+ LG cells (E), gating of c‐kit+bright and c‐kit+dim cells (F), and isotype control antibody staining shows no labeled cells (G). (H, I): Gating of LG EpCAM+ cells (H, I: red square in H and red peak in I are EpCAM− cells; blue square in H and blue peak in I are EpCAM+ cells). (J): Isotype control antibody staining shows no labeled cells (blue square). (K): Gating the c‐kit+bright cells: all c‐kit+bright cells are EpCAM‐/CD45+ (blue square). (L): Gating of c‐kit+dim/EpCAM+/CD45‐ cells. C‐kit+dim events: red square, c‐kit+dim/EpCAM+/CD45− cells, 22%; green square, kit+dim/EpCAM−/CD45+ cells, 70%; yellow square, kit+dim/EpCAM−/CD45− cells, less than 8%. (M): Gating and isolation of epithelial progenitor cell (EPCP) (c‐kit+dim/EpCAM+/CD45− /CD34−/Sca1− red square). (N): Putative EPCPs express stem cell markers. Gene expression in sorted EPCPs (c‐kit+dim/EpCAM+ cells) were compared with isolated c‐kit−/EpCAM+ epithelial cells using a RT2 First Strand Kit (catalog no. 330401; SABiosciences, Qiagen) and applied to The Mouse Stem Cell Transcription Factors RT2 Profiler Array. Only genes changed 1.5‐fold with significantly different expression levels (p < .01) are shown. Statistical analysis was performed by using real‐time polymerase chain reaction data from three independent RNA preparations. Abbreviations: DAPI, 4′,6‐diamidino‐2‐phenylindole; EpCAM, epithelial cell adhesion molecule; FSC‐W, forward scatter pulse width.