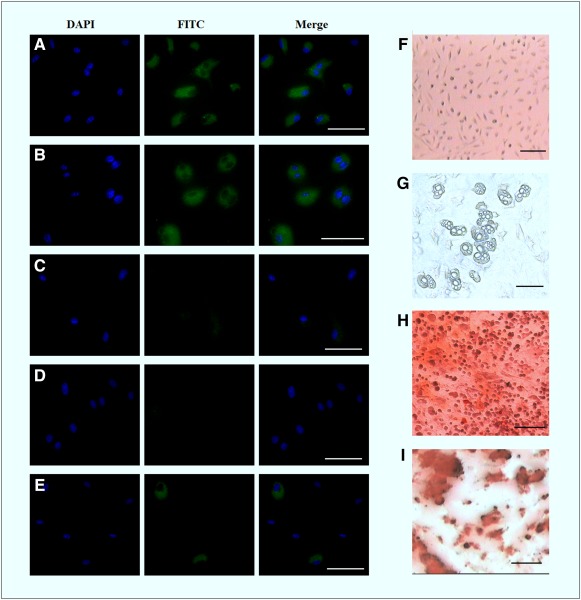
Figure 2.

Phenotypic and differential characterization study of mMSCs. Phenotypic surface antigens’ characterization of isolated mMSCs by immunocytochemistry: Sca1 (A), CD90.2 (B), CD34 (C), CD45(D), and CD11b (E). Blue fluorescent indicated Hoechst 33342 staining of nucleus, and green fluorescent indicated FITC conjugated antibodies. Scale bar: 50 µm. Osteogenic and adipogenic differentiation of mMSCs after incubation for 21 days in induction media: control MSCs (F), appearance of lipid vacuoles (G), alizarin staining for osteogenesis (H), and Oil Red O staining for adipogenesis (I). Scale bar = 100 µm. Abbreviations: DAPI, 4′,6‐diamidino‐2‐phenylindole; FITC, fluorescent isothiocyanate; mMSC, mice mesenchymal stem cell.
