Figure 4.

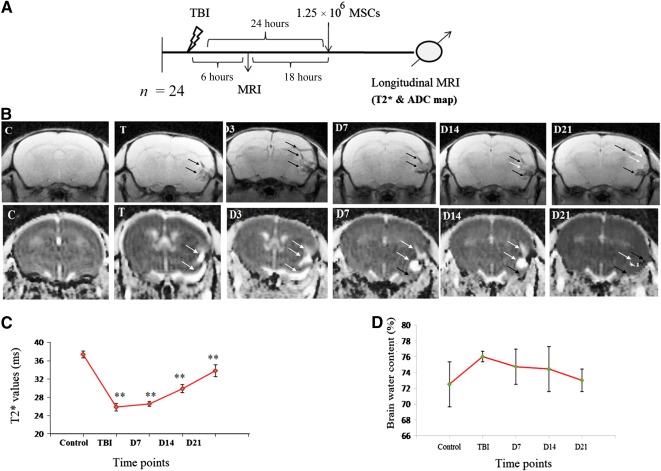
Infused MSCs increases the T2* time and decreases the edema formation at the injury site. (A): Schematic presentation of TBI induction, MSC transplantation and longitudinal MRI (T2* map) of animals at different time points. (B): Upper MRI images indicating T2* map of mouse brain at different time points using MGE_T2* sequence, and lower images indicating ADC map of mouse brain at different time points using DTI sequence, C, T, D3, D7, D14, and D21 indicated imaging after administration of MSCs in TBI mouse. (C): The graph presents measurement of T2* relaxation time after acquisition of T2* map at different time points. (D): Ex vivo measurement of total brain water content in different time points. White arrow indicates the appearance of edema (hyperintense signal), and black arrow indicates the injury area (hypointense signal) in T2* and ADC map. Data were expressed as mean ± SE of mean. The level of significance (∗, p ≤ .05, ∗∗, p ≤ .001) was shown by comparing with control using one‐way ANOVA‐Bonferroni post hoc tests. Abbreviations: ADC, apparent diffusion coefficient; ANOVA, analysis of variance; C, control; D, day; DTI, diffusion tensor imaging; MGE, multigradient echo; MRI, magnetic resonance imaging; MSC, mesenchymal stem cell; T, after TBI induction.
