
Figure 5.
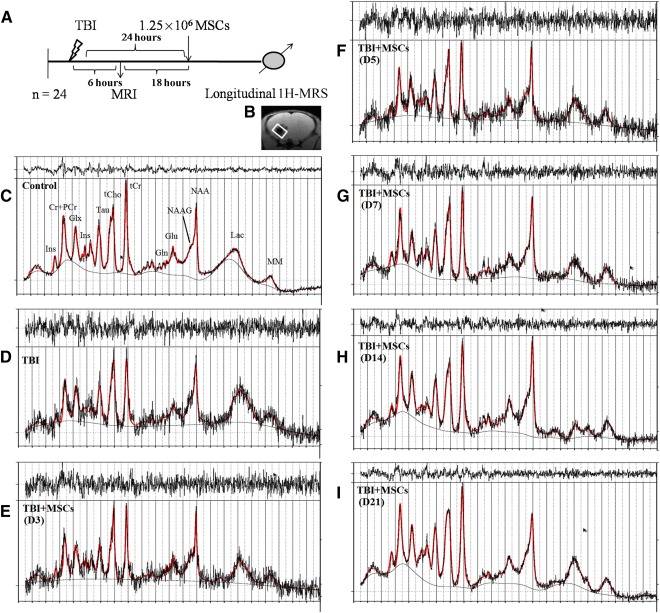
Spectra represents the neurometabolic alteration after injury and its restoration after MSC administration. (A): Schematic presentation of TBI induction, MSC transplantation, and acquisition of 1H‐MRS at injury area of animals at different time points. (B): A representation of voxel placement with volume of interest at injury site for acquisition of spectra from corresponding brain area. (C): Representative 1H‐MRS spectra acquired in control mouse. (D): Spectra acquired after TBI and after MSCs transplantation on D3 (E), D5 (F), D7 (G), D14 (H), and D21 (I), with respective neurochemical peaks. The solid red line is a fit to the spectra calculated by the LC model. Abbreviations: Cr, creatine; D, day; Gln, glutamine; Glu, glutamate; Glx, glutamine complex; 1H‐MRS, proton magnetic resonance spectroscopy; Ins, myo‐inositol; Lac, lactate; LC, linear combination; MM, macromolecules; MRI, magnetic resonance imaging; MSC, mesenchymal stem cell; NAA, N‐acetylaspartate; NAAG, N‐acetylaspartatyl glutamate; PCr, phosphocreatine; Tau, taurine; TBI, traumatic brain injury; tCho, total choline; tCr, total creatine.