
Figure 6.
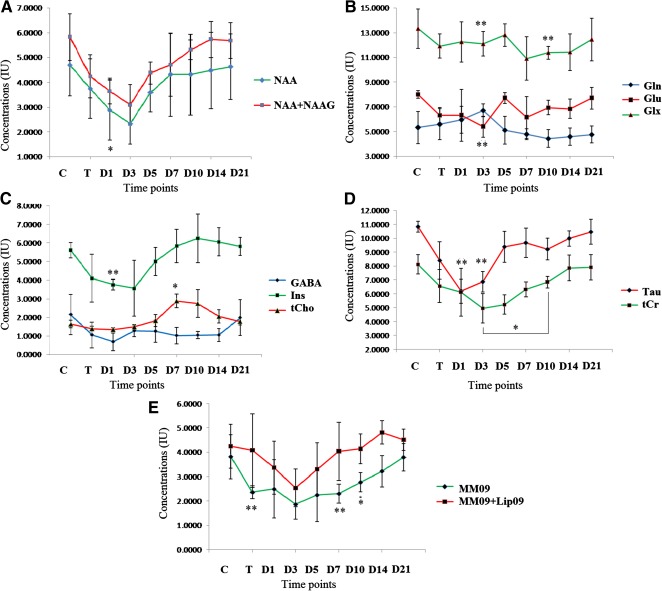
Changes in selected neurochemicals measured with 1H‐MRS. The change of metabolic concentrations of different metabolites such as NAA and NAA + NAAG (A), Gln, Glu and Glx (B); GABA, Ins, and tCho (C); Tau and tCr (D); and MM09 and MM09 + Lip09 (E) were evaluated with respect to different time points. Most of the metabolites decreased in concentration after TBI, but the levels remained recovered and moved toward baseline after MSC transplantation. Concentrations were expressed in institutional units and represented as mean ± SE of mean. The level of significance (∗, p ≤ .05, ∗∗, p ≤ .001) was shown by comparing with control by repeated measures of one‐way ANOVA‐Bonferroni post hoc tests. Abbreviations: ANOVA, analysis of variance; Cr, creatine; D, day; GABA, γ‐aminobutyric acid; Gln, glutamine; Glu, glutamate; Glx, glutamine complex; 1H‐MRS, proton magnetic resonance spectroscopy; Ins, myo‐inositol; MSC, mesenchymal stem cell; NAA, N‐acetylaspartate; NAAG, N‐acetylaspartatyl glutamate; T, after TBI induction; TBI, traumatic brain injury; tCho, total choline; Tau, taurine.