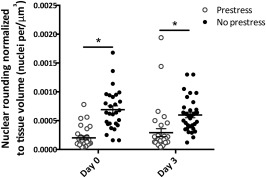
Figure 3.

Number of rounded cell nuclei in the cambium of periosteum with and without prestress immediately after harvest (day 0) and 3 days after harvest (day 3), normalized to tissue volume (nuclei per μm3). Line represents the median value of the group. ∗, p < .01 for comparison with prestress group. Error bars represent SEM.
