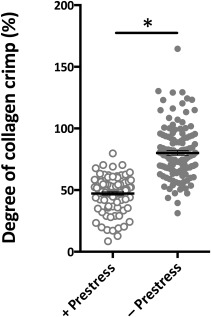
Figure 6.

Degree of collagen crimp between samples with and without prestress immediately after harvest. In samples maintaining prestress, significantly less collagen crimp was observed than in samples without prestress. Line represents the median value of the group. ∗, p < .01 for comparison with prestress group. Error bars represent SEM.
