
Figure 5.
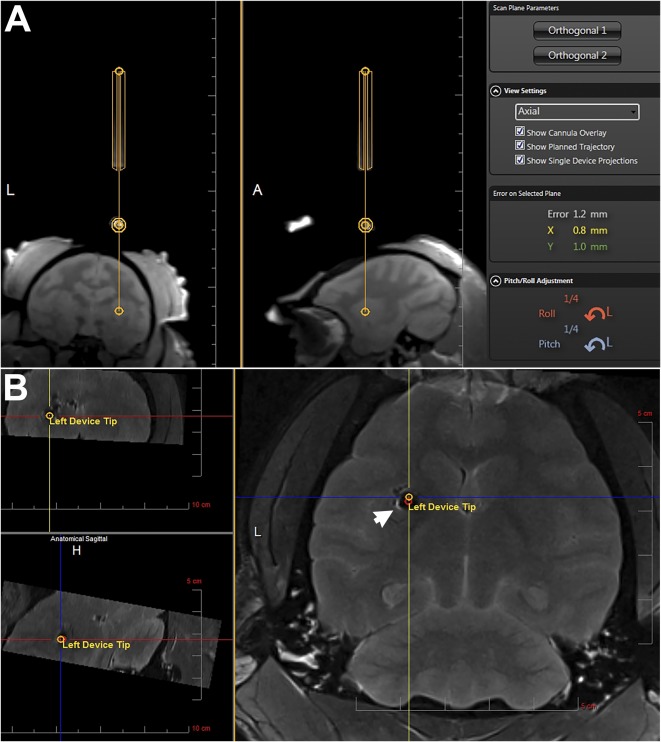
Finalizing trajectory and cannula entry. (A): Representative slices of the orthogonal alignment images shown in the ClearPoint software. The yellow lines outline the segmentation of the cannula guide. The software‐calculated adjustments are shown in orange (Roll) and blue (Pitch) on the bottom right. (B): Postinjection magnetic resonance image overlaid with the planned target and cannula tip (Left Device Tip) as calculated by the ClearPoint software showing the superparamagnetic iron oxide‐labeled neural stem cell graft (arrow, hypointense area) on target. Abbreviations: A, anterior; H, head; L, left.