
Figure 1.
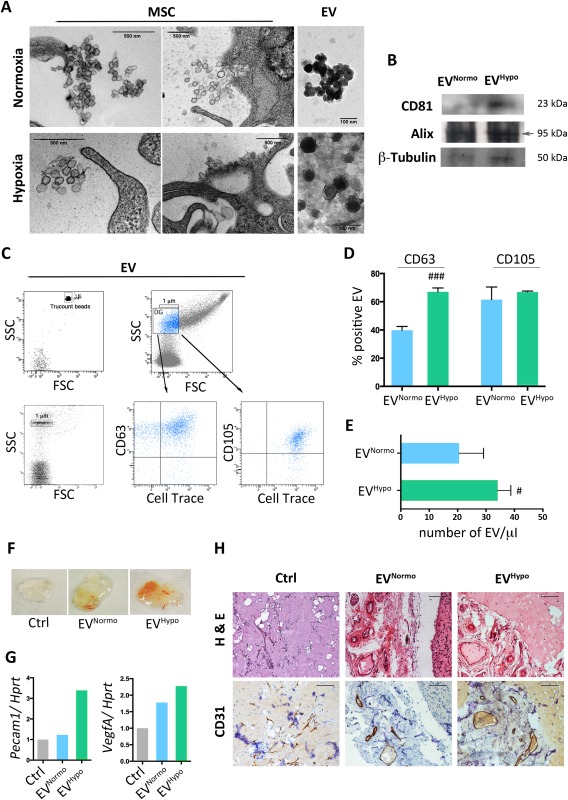
MSC‐derived EV characterization. (A): Transmission electron microscopy analysis of MSC cultured for 48 hours in normoxic and hypoxic conditions and corresponding isolated EVNormo and EVHypo. Scale bars: MSC panels = 500 nm; EV panels = 100 nm. (B): Representative Western blot analysis for EV specific markers (CD81 and Alix) and for β‐Tubulin. (C): Flow cytometry strategy adopted to characterize EVNormo and EVHypo. Vesicles were stained by the lipophilic dye Cell Trace, the vesicular marker CD63 and the MSC marker CD105. (D): Histogram showing the percentage of Cell Tracepos EVs coexpressing CD63 or CD105. Data are presented as mean ± SD. ###, p = .0003 (unpaired Student's t test). (E): Histogram showing the absolute number of Cell Tracepos EVs quantified trough Trucount fluorescent beads. Data are presented as mean ± SD. #, p = .0318 (unpaired Student's t test). (F): Representative photo of Matrigel plugs in combination with PBS (Ctrl), 5 μg of EVNormo or 5 μg of EVHypo, recovered 3 weeks after their in vivo injection. (G): Histograms summarizing densitometric analysis of PCR products normalized to the housekeeping gene Hprt. Pecam1; VegfA. (H): Representative histology of Matrigel plug sections stained for hematoxylin and eosin (upper panels) and for the endothelial cell marker CD31 (lower panels). Magnification ×40. Scale bar = 100 μm. Abbreviations: EVs, extracellular vesicles; FSC, forward scatter channels; Hprt, hypoxanthine guanine phosphoribosyltransferase; MSCs, mesenchymal stem cells; Pecam1, platelet and endothelial cell adhesion molecule 1; SSC, side scatter channels; VegfA, vascular endothelial growth factor A.