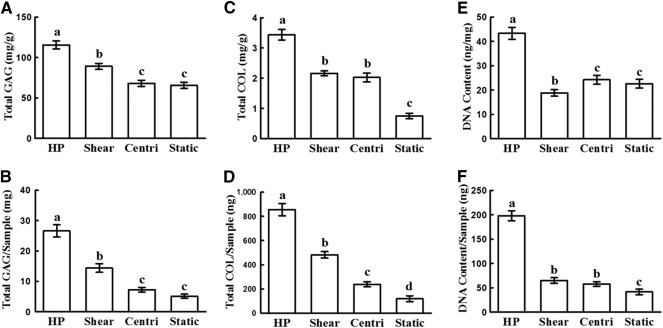
Figure 4.

Quantitative evaluation of cartilage formation. (A–E): The quantitative analyses show that the HP group achieved the highest contents of total GAG, total COL, and DNA, with significant differences (p < .05) among groups. (A–D): The shear group showed greater content of total COL and total GAG, with significant differences (p < .05) compared with those in static group. (C, D): In the centri group, only total COL contents showed significant differences (p < .05) compared with the static group. Error bars indicate SD; a–d, p < .05. Abbreviations: centri, centrifugal force control group; COL, collagen; GAG, glycosaminoglycan; HP, hydrostatic pressure.
