
Figure 4.
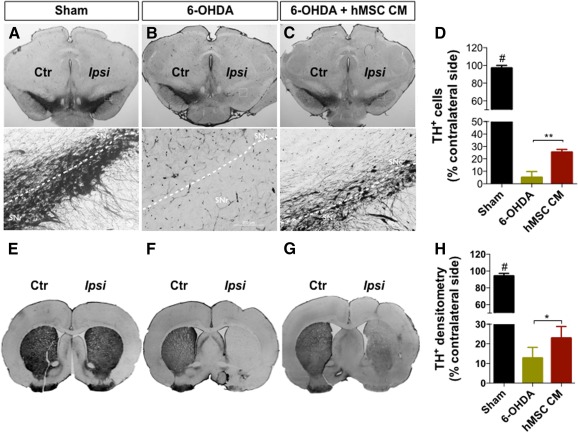
Representative photomicrographs of brain slices stained for TH. Compared with the sham group (A, E), all animals that were submitted to 6‐OHDA injection exhibited reduced TH staining both in the SNc and striatum (STR). However, animals injected with the hMSC CM (i.e., secretome) (C, G) had significantly more TH‐positive staining when compared with the 6‐OHDA group (B, F). (D): Quantification of TH‐positive cells on SNc revealed approximately 95% degeneration in the 6‐OHDA group and approximately 75% in the CM‐injected animals. (H): At the STR level, the quantification of TH staining revealed a degeneration of approximately 88% in the 6‐OHDA group, and approximately 77% in the CM‐injected animals. Data are presented as mean ± SEM. There were nine animals in the sham group and in the 6‐OHDA group, and eight in the hMSC CM group. ∗, p < .05, ∗∗, p < .01; #, sham animals statistically different from 6‐OHDA‐ and hMSCs CM‐injected animals, p < .001. Scale bars = SNc, 200 μm; STR, 1 mm. Abbreviations: Ctr, control; hMSC CM, human mesenchymal stem cell‐conditioned medium; Ipsi, ipsilateral; 6‐OHDA, 6‐hydroxidopamine; SNc, substantia nigra pars compacta; SNr, substantia nigra pars reticulata; TH+, tyrosine hydroxylase positive.