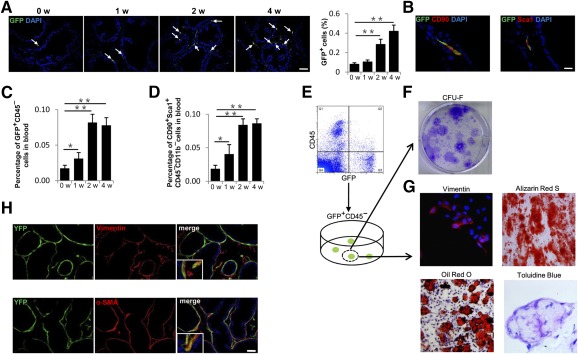
Figure 3.

Increased nestin+ cells in prostate stroma are a subset of mesenchymal/stromal stem cells. (A): Immunofluorescence analysis of prostate tissue sections from Nestin‐GFP transgenic mice at 0, 1, 2, and 4 weeks after initial PE injection using antibody against GFP. Arrows indicate GFP+ cells. Bar graph on the right shows the quantitative analyses of the ratio of GFP+ cells to total cells. Scale bar = 50μm. (B): Double‐immunohistofluorescence analysis of prostate tissue sections from Nestin‐GFP mice using antibodies against GFP and CD90 or Sca1. Scale bar = 20 μm. (C): Flow cytometry analysis of GFP+CD45–cells (percentage of total cells counted) in blood of Nestin‐GFP mice at indicated time points after PE injection. (D): Flow cytometry analysis of CD90+Sca1+CD11b–CD45– cells (percentage of total cells counted) in blood of wild‐type mice at indicated time points after PE injection. (E): Fluorescence‐activated cell sorting of GFP+CD45−cells from ventral prostate tissue of 6‐week‐old Nestin‐GFP mice. (F): Single CFU‐F‐derived GFP+CD45− cell strains were isolated and individually expanded for characterization assays. (G): Single GFP+CD45− clones were isolated, expanded, and cultured. Cells were separately incubated with fibrogenic media, osteogenic media, adipogenic media, and chondrogenic media, and they were stained for vimentin (upper left panel), Alizarin Red S (upper right panel), Oil Red O (lower left panel), and Toluidine Blue (lower right panel), respectively. (H): Double‐immunohistofluorescence analysis of prostate tissue sections from 6‐week‐old Nestin‐Cre, Rosa26‐YFPflox/+ mice using antibodies against YFP (green) and vimentin (red, top panels) or α‐SMA (red, bottom panels). Scale bar = 50μm. n = 4–5 per group. Data are shown as the mean ± SD. ∗, p < .05, ∗∗, p < .01 determined by multifactorial analysis of variance. Abbreviations: CFU‐F, colony‐forming unit fibroblast; DAPI, 4′,6‐diamidino‐2‐phenylindole; GFP, green fluorescent protein; PE, phenylephrine; α‐SMA, α‐smooth muscle actin; w, weeks.
