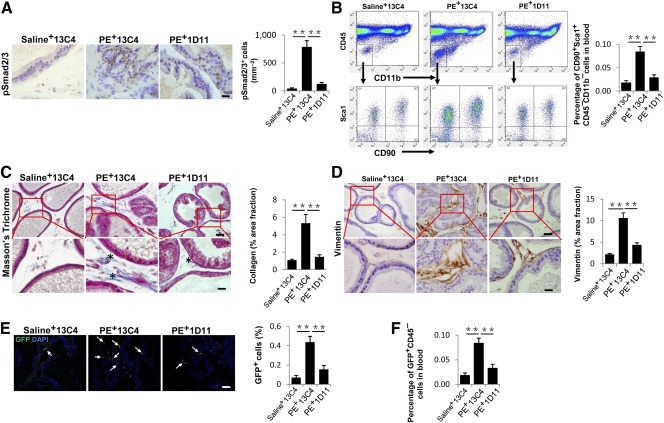
Figure 5.

TGF‐β neutralizing antibody (1D11) treatment inhibits prostatic stromal hyperplasia and mesenchymal/stromal stem cell accumulation in PE‐induced mice. Saline or PE‐challenged mice were treated with TGF‐β neutralizing antibody 1D11 (5 mg/kg−1) or the equivalent volume of control antibody 13C4 three times per week. (A): Immunohistochemical staining (left) and quantitative analyses (right) of pSmad2/3+ cells (brown) in prostate tissue of three treatment groups. Scale bar = 20 μm. (B): Flow cytometry analysis of the percentage of CD90+Sca1+CD11b–CD45– cells in blood cells of wild‐type mice in three groups. (C): Masson's trichrome staining of the prostate tissue of three groups. Quantitative analyses of the percentage of collagen stained areas (asterisk) are shown in the right bar graph. Scale bars = 50 μm in top panels, 20 μm in bottom panels. (D): Immunohistochemical staining (left) and quantitative analyses (right) of vimentin (brown). Panels in the bottom are at higher magnification of red boxed area in the top panel. Scale bars = 50 μm in top panels, 20 μm in bottom panel. (E): Immunofluorescence staining of GFP (arrows) of Nestin‐GFP mice in three groups. Bar graph shows the quantitative analyses of the ratio of GFP+ cells to total cells. Scale bar = 50 μm. (F): Flow cytometry analysis of the percentage of GFP+CD45− in blood cells of Nestin‐GFP mice in three groups. All data were obtained from saline or PE‐treated mice 4 weeks after initial injection. n = 5 per group (A–E). Data are shown as the mean ± SD. ∗∗, p < .01 determined by multifactorial analysis of variance. Abbreviations: DAPI, 4′,6‐diamidino‐2‐phenylindole; GFP, green fluorescent protein; PE, phenylephrine; TGF, transforming growth factor.
