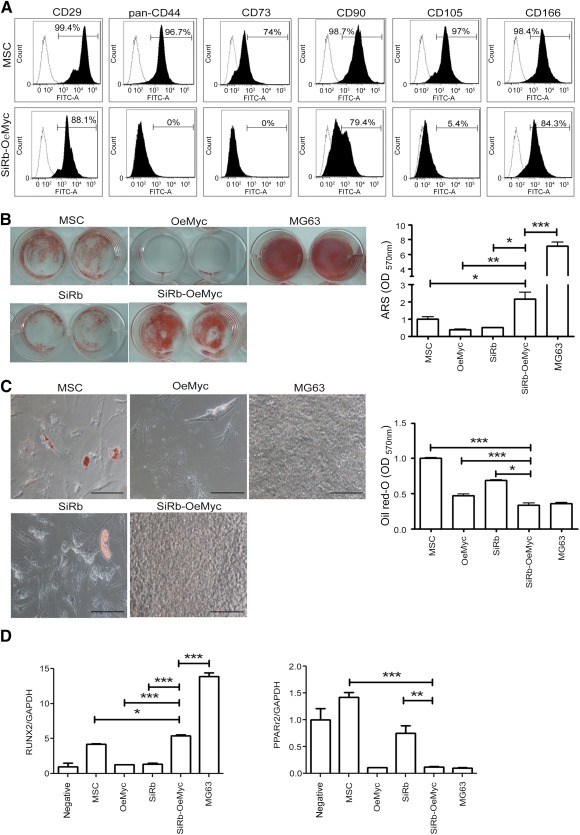
Figure 2.

Combination of retinoblastoma (Rb) knockdown and c‐Myc overexpression caused phenotypic changes. (A): Flow cytometric analysis for cell surface markers in parental MSCs and MSCs with SiRb and c‐Myc overexpression (SiRb‐OeMyc). (B left): Cells were induced for osteogenesis in osteogenic induction medium for 2 weeks, followed by ARS staining. (B right): Stained dye was extracted, and OD values were measured. (C left): Cells were induced for adipogenesis in adipogenic induction medium for 2 weeks, followed by Oil Red O staining. (C right): Stained dye was extracted, and OD values were measured. Bars = 100 μm. The gene expression levels of RUNX2 at 7 days of osteogenic induction and PPARγ2 at 7 days of adipogenic induction were analyzed by quantitative reverse‐transcriptase polymerase chain reaction assay. (D): Compared with parental MSCs, SiRb‐OeMyc cells significantly increased in RUNX2 mRNA level (left), whereas they decreased in PPARγ2 mRNA level (right). ∗, p < .05; ∗∗, p < .01; ∗∗∗, p < .005 compared with MSC. Abbreviations: ARS, Alizarin Red S; GAPDH, glyceraldehyde‐3‐phosphate dehydrogenase; MSC, mesenchymal stem cell; OD, optical density; OeMyc, overexpression of c‐Myc; PPARγ2, peroxisome proliferator‐activated receptor γ2; Rb, retinoblastoma; RUNX2, runt‐related gene 2; SiRb, silence of Rb.
