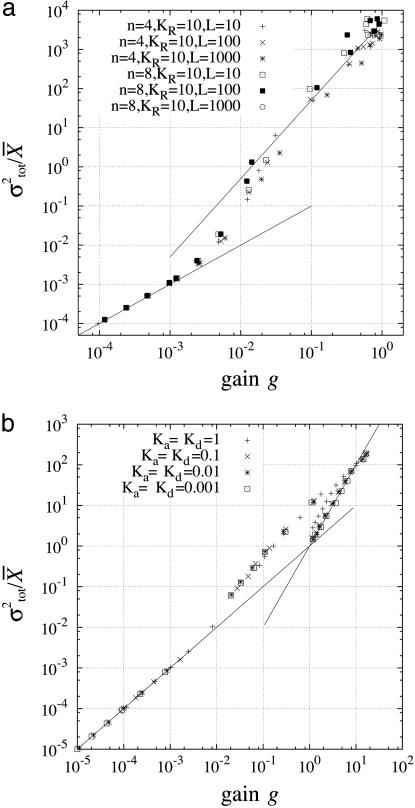
Fig. 4.
Amplification of noise in signal-transduction systems. To show the dependence of the total noise intensity σtot on the gain g, σtot/X̄ is plotted as a function of the gain g. Changing the average concentration of the input signal, g, σtot, and X̄ were obtained numerically. The numerical calculation was performed by using the Gillespie's algorithm (20), as in Fig. 3. In the present case, the concentration of the input signal also fluctuates in time, and the average concentration increases under the condition that the relative noise intensity is maintained to be constant. The following parameters are shown: the MWC model KT = 1, KR indicated in a; the push–pull reaction, Va = Vd = 10, Ka and Kd indicated in b.

