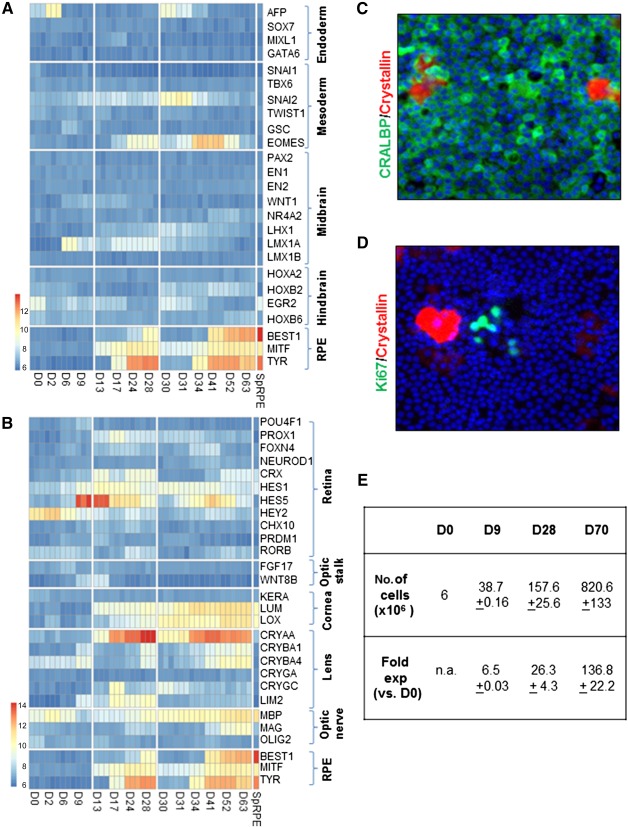
Figure 6.

Specificity and efficiency of retinal pigment epithelium (RPE) differentiation. (A, B): Microarray heatmap showing expression of markers representative of different lineages and brain regions (A) and regions of the eye (B). The x‐axis refers to samples at different time points of directed differentiation and the Sp. RPE samples refer to RPE generated by spontaneous differentiation. (C, D): Representative images for immunocytochemistry of CRALBP (green) and β‐crystallin (red) (C) and Ki67 (green) and β‐crystallin (red) (D) are shown. Images are captured at ×10 magnification. (E): Table summarizing yield and fold expansion of cells at various stages of the directed differentiation protocol. Abbreviations: D, day; exp, expansion; n.a., not applicable; RPE, retinal pigment epithelium; SpRPE, RPE generated by spontaneous differentiation.
