
Figure 4.
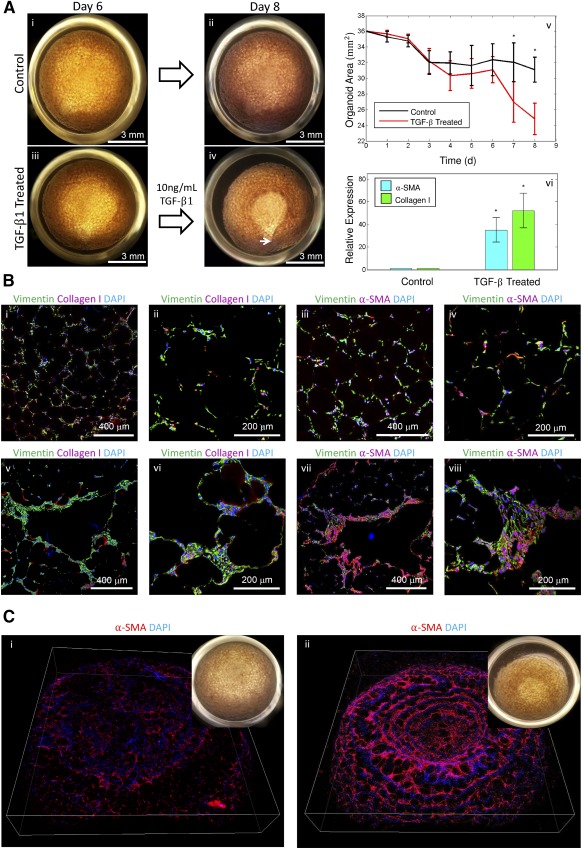
Effect of TGF‐β1 on organoid contraction and development of a fibrotic phenotype. (Ai, Aii): Representative control organoid imaged on days 6 and 8 after seeding (scale bar = 3 mm). (Aiii, Aiv): Representative organoid treated with TGF‐β1 during the same 2‐day period. The organoid contracted forming a saddle‐like geometry with the focal point near the bottom of the image indicated by an arrow (scale bars = 3 mm). (Av): Aggregate analysis of 20 organoids (10 experimental, 10 control) analyzed during the 8‐day experiment. TGF‐β1 was administered on day 6; thereafter, a clear separation between experimental and control organoid contraction was observed; ∗, p < .05. (Avi): Expression levels of two key genes involved in fibrosis, collagen I and α‐SMA, on treatment with 10 ng/ml TGF‐β1 by quantitative polymerase chain reaction; ∗, p < .05. (Bi–Biv): Confocal immunofluorescence micrographs of representative control organoid sections for vimentin, collagen I, α‐SMA, and DAPI. (Bv–Bviii): Confocal immunofluorescence micrograph of representative TGF‐β1 treated organoid sections for vimentin, collagen I, α‐SMA, and DAPI. Fibrotic areas show increased accumulation of cells that stain positive for collagen I and α‐SMA resembling fibrotic foci, the hallmark of idiopathic pulmonary fibrosis. (Scale bars = 400 μm [Bi, Biii, Bv, Bvii], 200 μm [Bii, Biv, Bvi, Bviii].) (Ci): Merged, rotated confocal z‐stack of patient, iPSC‐derived, α‐SMA reporter line control organoid. Inset, white light image of organoid. (Cii): Merged confocal z‐stack of patient, iPSC‐derived, α‐SMA reporter line organoid treated with TGF‐β1. Inset, white light image of organoid showing high degree of contraction. Abbreviations: DAPI, 4′,6‐diamidino‐2‐phenylindole; α‐SMA, α‐smooth muscle actin; TGF, transforming growth factor.