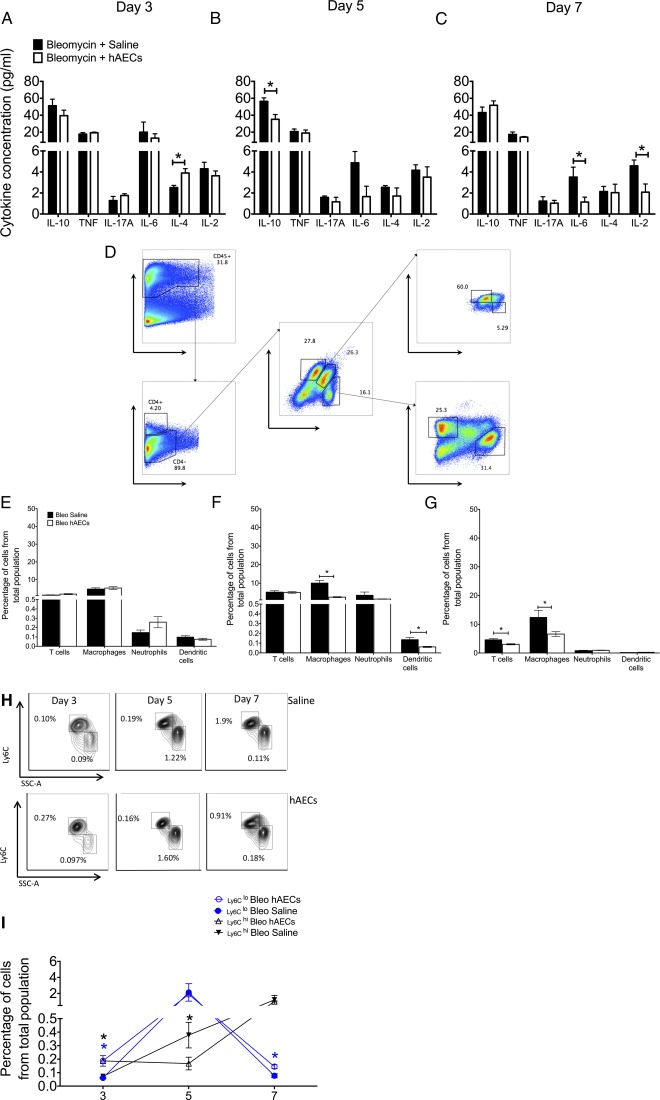
Figure 1.

hAECs altered cytokine expression and immune cell infiltrate in vivo. (A): Administration of hAECs significantly increased anti‐inflammatory IL‐4 cytokine levels at the onset of inflammation (control group: 2.52% ± 0.20% vs. hAEC group: 3.90% ± 0.42%). Expression of IL‐10 (B) and inflammatory IL‐6 and IL‐2 levels (C) were reduced in animals that received hAECs (control vs. hAEC groups: IL‐10: 56.36% ± 4.199% vs. 35.17% ± 5.67%; IL‐6: 3.52% ± 0.94% vs. 1.14% ± 0.46%; IL‐2: 4.58% ± 0.55% vs. 2.08% ± 0.78%). (D): Immune cell populations were measured via flow cytometry with gating strategies. Percentages on flow cytometry plots represent the percentages from the parent population. Table 1 lists markers used for each population. There was no change in percentage in all immune cell types at day 3 (E). (F, G): F4/80‐positive macrophage numbers were reduced by day 5 (F) and day 7 (G) in mice given hAECs (day 5: 10.05% ± 1.48% vs. 2.49% ± 0.25%; day 7: 12.39% ± 2.45% vs. 6.59% ± 0.84%). (F): Dendritic CD11c+ cell numbers were significantly reduced at day 5 (control group: 0.13% ± 0.02% vs. hAEC group: 0.06% ± 0.01%). (G): Administration of hAECs slightly reduced CD4 T‐cell numbers in the lung at day 7 (control group: 4.60% ± 0.40% vs. hAEC group: 3.03% ± 0.20%). (H): Representative flow cytometry plots for monocytic subpopulations CD11b+/ Ly6C+ cells are shown. Percentages on flow cytometry plots represent the percentages from parent population. (I ): Changes in Ly6Clo and Ly6Chi cells across days 3, 5, and 7 are shown. Percentage of Ly6Chi cells peaked at day 5 and decreased by day 7 in both groups; hAEC administration resulted in significantly increased percentages of Ly6Clo monocytes at days 3 and 7 (day 3: 0.072% ± 0.012% vs. 0.187% ± 0.039%; day 7: 0.084% ± 0.013% vs. 0.145% ± 0.015%). in both groups. The percentage of Ly6Chi cells gradually increased from day 3 to day 7 in both groups. hAEC treatment resulted in significantly increased percentages of Ly6Chi cells on days 3 and 5 (day 3: 0.001% ± 0.0002% vs. 0.005% ± 0.001%; day 7: 0.006% ± 0.001% vs. 0.053% ± 0.011%). ∗, p < .05. Abbreviations: bleo, bleomycin; hAEC, human amnion epithelial cell; IL, interleukin; TNF, tumor necrosis factor; FSC, forward scatter; SSC, side scatter.
