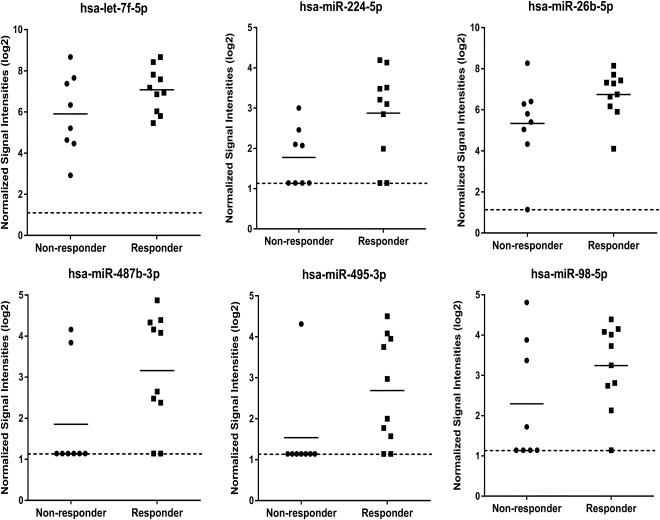
Figure 1.

MicroRNA (miRNA) microarray expression data showing circulating miRNAs identified as being upregulated in plasma samples in the responder group as compared to the nonresponder group. The expression data is given as normalized signal intensities on a log 2 scale. Data is shown for the responder samples (n = 10) and nonresponder samples (n = 8) which generated microarray data from the 10 responder and 10 nonresponder samples analyzed (see Supporting Information data for details). Short solid lines on graphs indicates mean expression in each group. Dotted line on graphs indicates the lower limit of detection on the miRNA microarrays.
