Figure 2.

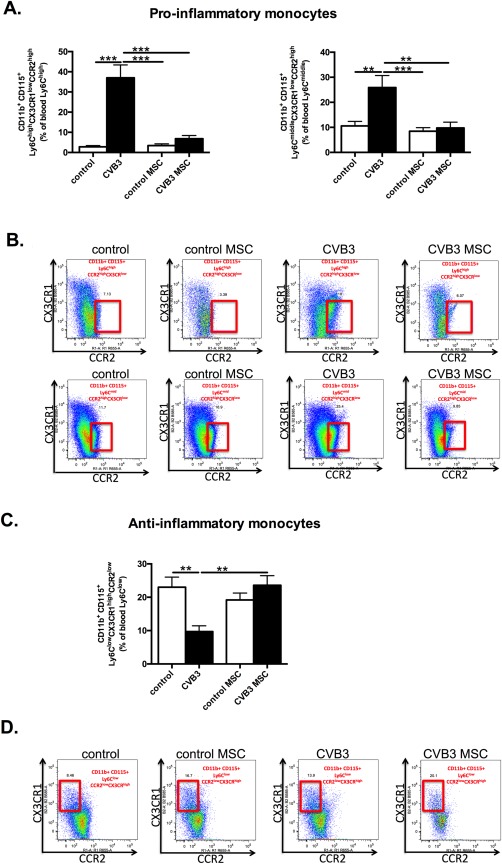
(See prior page) MSCs modulate monocyte subsets in the blood of coxsackievirus B3‐infected mice. (A): Bar graphs represent the mean ± SEM of CD115+CD11b+Ly6ChighCCR2highCXC3CR1low and CD115+CD11b+Ly6CmiddleCCR2highCXC3CRlow positive cells in the blood of control mice (open bar) and CVB3‐infected mice (closed bar) injected with PBS or MSC, expressed as the percentage of Ly6Chigh and Ly6Cmiddle positive cells, respectively with n = 8–9 per group and **, p < .01; ***, p < .001. (B): The panel represents dot plots of blood CD115+CD11b+Ly6ChighCCR2high CXC3CR1low and CD115+CD11b+Ly6CmiddleCCR2highCXC3CRlow positive cells as percentage of Ly6Chigh or Ly6Cmiddle cells, as indicated. (C): Bar graphs represent the mean ± SEM of CD115+CD11b+LyC6lowCCR2low CXC3CRhigh positive cells in the blood of control mice (open bar) and CVB3‐infected mice (closed bar) injected with PBS or MSC, expressed as the percentage of Ly6Clow positive cells with n = 8–9 per group and **, p < .01. (D): The panel represents dot plots of blood anti‐inflammatory CD115+CD11b+Ly6ClowCCR2lowCXC3CRhigh positive cells as the percentage of Ly6Clow cells, as indicated. Abbreviations: CCR2, chemokine (C‐C motif) receptor‐2; CVB3, coxsackievirus B3; CX3CL1, chemokine (C‐X3‐C motif) ligand‐1; MSC, mesenchymal stromal cell.
