
Fig. 2.
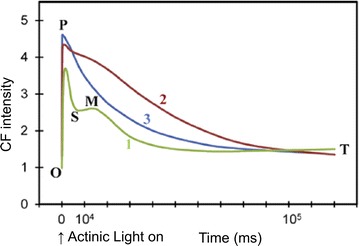
The Kautsky effect, showing the CF transient as well as its intensity dependence. Wavelength of excitation: 650 nm. Excitation light intensity for curves labeled 1, 2 and 3 was 32, 320 and 3200 μmol/m2/s, respectively. For definition of OPSMT, O is the origin, P is the peak, S stands for semi-steady state, M for a local maximum, and T for a terminal steady state level
(Modified figure from [1], with copyright permission)