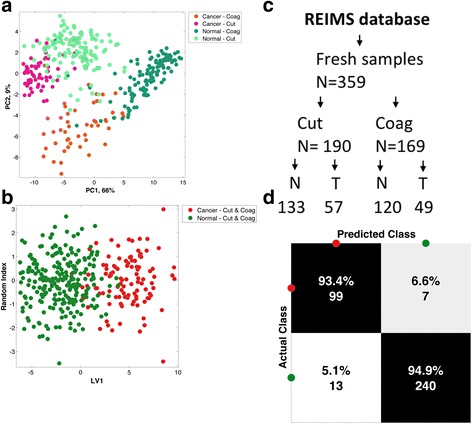
Fig. 3.

Multivariate statistical analysis of the combined cut and coag model. a Unsupervised principal component (PC) analysis of the spectral differences (600–1000 m/z) between normal tissue compared to breast cancer in the cut and coag electrosurgical modalities. b Supervised linear discriminant analysis plot comparing normal tissue (N) to tumour/cancer (T) regardless of electrosurgical modality. c Flow diagram of sample selection for building of the rapid evaporative ionisation mass spectrometry (REIMS) database. d Confusion matrix demonstrating diagnostic accuracy of the combined electrosurgical model following leave-one-patient-out cross-validation (LV1), with sensitivity (93.4%) and specificity (94.9%)
