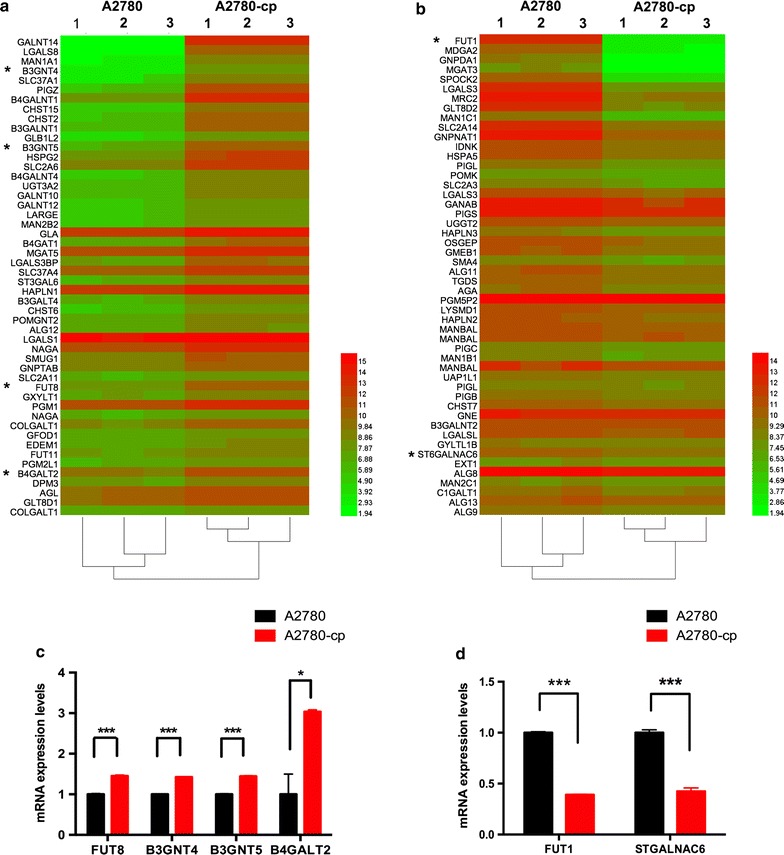
Fig. 3.

Heatmap of the altered glycan gene expression. a The 50 genes exhibiting the greatest increases are shown in the heat map. b The 50 genes exhibiting the greatest decreases are shown in the heatmap. *Genes showing significant changes that correlated well with the lectin array results. c, d Real-time PCR validation of expression array results
