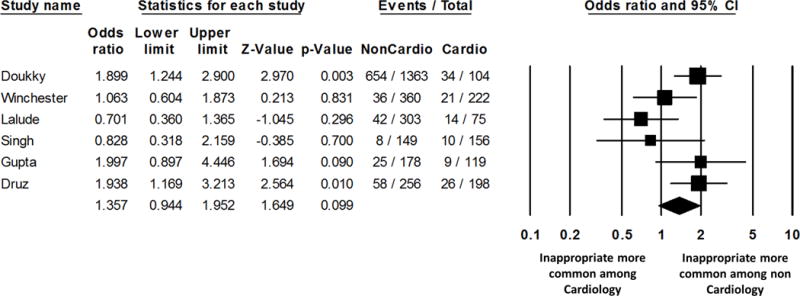
Figure 4.

Summary plot for the rate of inappropriate testing according to provider.
The relative size of the data markers indicates the weight of the sample size from each study.
CI = confidence interval; MPI= myocardial perfusion imaging

Summary plot for the rate of inappropriate testing according to provider.
The relative size of the data markers indicates the weight of the sample size from each study.
CI = confidence interval; MPI= myocardial perfusion imaging