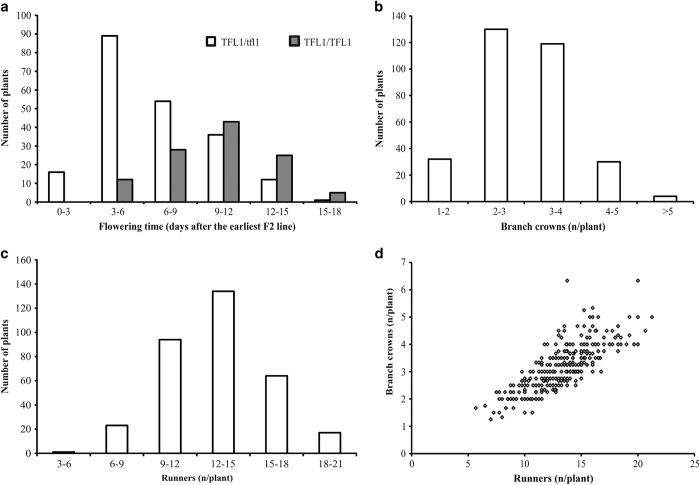
Figure 1.
Segregation of flowering time and vegetative traits in H4×FV mapping population. Segregation of flowering time (a), the number of branch crowns (b) and runners (c), and correlation between the number of branch crowns and runners (d) are shown. Flowering time data is shown separately for plants homozygote or heterozygote for functional FvTFL1 alleles (FV alleles). Four clones of each of 335 F2 plants were phenotyped and mean values were used for analyses. Standard deviations of clones of each F2 line varied between 0.0 and 4.0 for flowering time, 0.0 and 2.1 for branch crowns, and 0.5 and 7.6 for runners.

