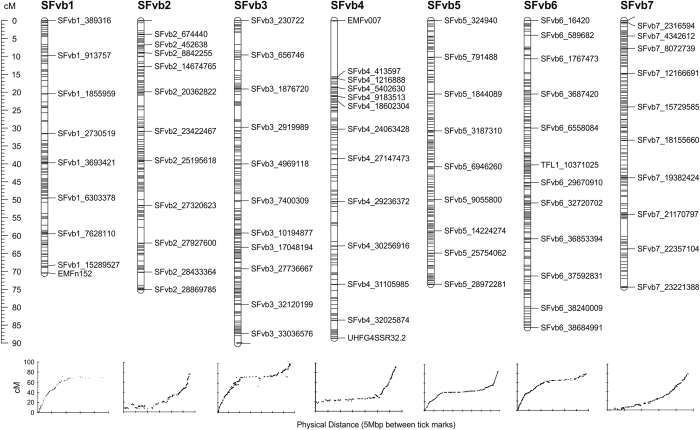
Figure 2.
Linkage map of 186 F2 progeny of the H4×FV cross comprising of 2395 molecular markers. The numbers at the top denote the chromosome number and the genetic distances are in centiMorgan (cM, scale in the left). In the small panels, all markers of each chromosome are plotted according to their position in the genome v.2.0 (x-axis) and in the genetic map (y-axis).

