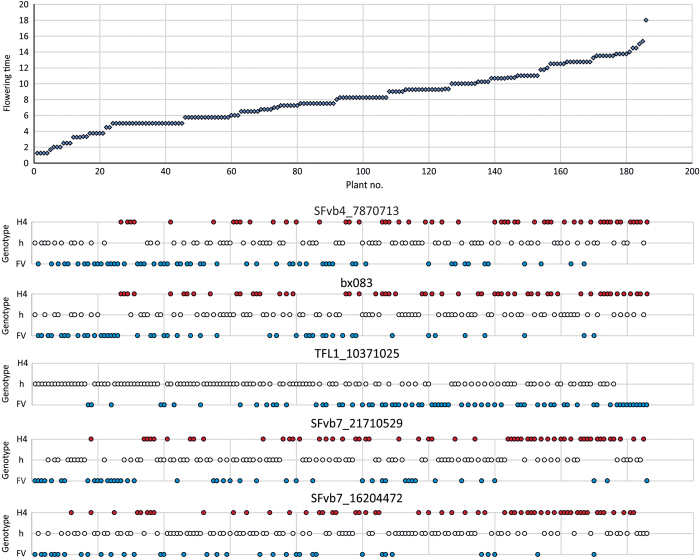
Figure 4.
The effect of different haplotype combinations on flowering time. Flowering time of each 186 F2 line and their haplotypes on five QTL regions are shown. Haplotypes were inferred from the marker with the highest LOD score for each QTL region. H4 and FV denote parental genotypes (H4=F. vesca f. semperflorens Hawaii-4, FV=F. vesca spp. vesca). h=heterozygote. Flowering time is shown as days after the earliest flowering line.

