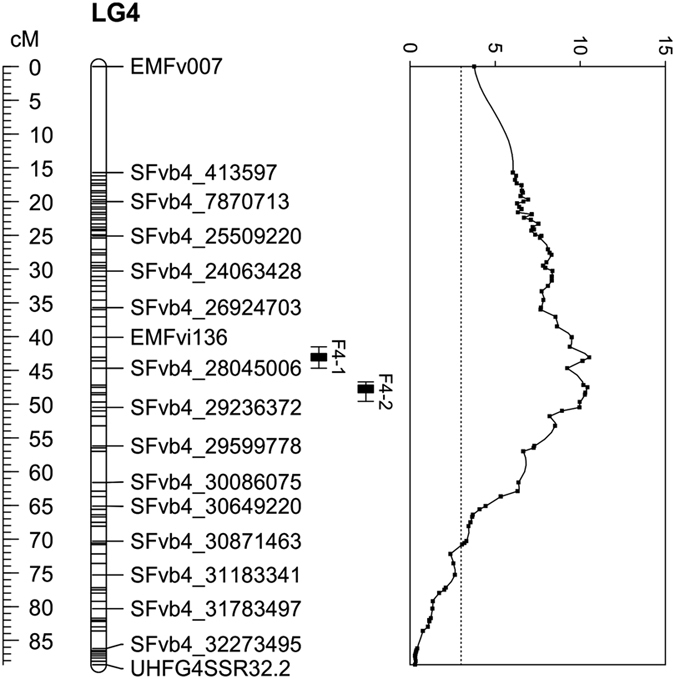
Figure 5.

Flowering time QTL on the chromosome 4 in the field experiment. The genetic map (left) and LOD scores (right) are shown. Bars denote areas with the highest LOD scores (QTL regions). H4×FV F2 lines (n=186) were grown in the field and flowering time was observed in summer 2011.
