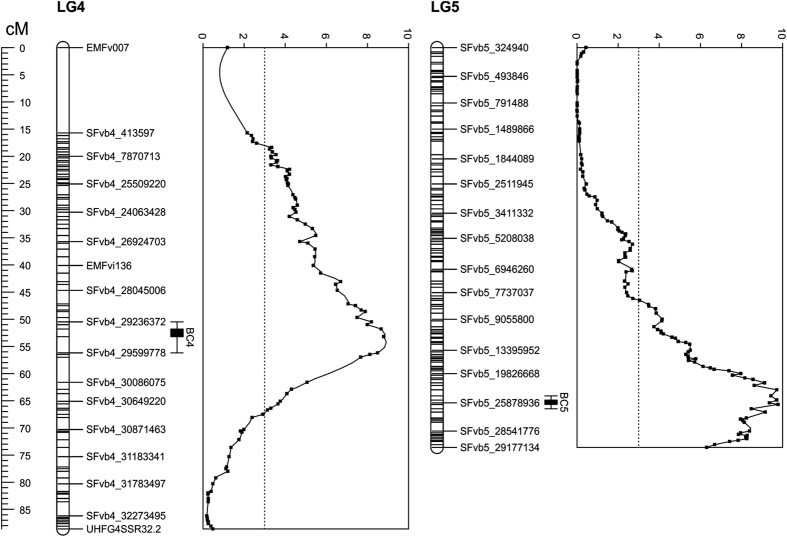
Figure 6.
QTLs for the number of branch crowns in the greenhouse experiment. Two QTLs for the number of branch crowns (BC4 and BC5) were detected in chromosomes 4 and 5. The genetic map (left) and LOD scores (right) are shown for each chromosome. Bars denote areas with the highest LOD scores (QTL regions). Field-grown plants were taken into the greenhouse in the middle of December 2011 for growth observations. Four clones of each of 186 F2 plants were phenotyped and mean values were used for the QTL analysis.

