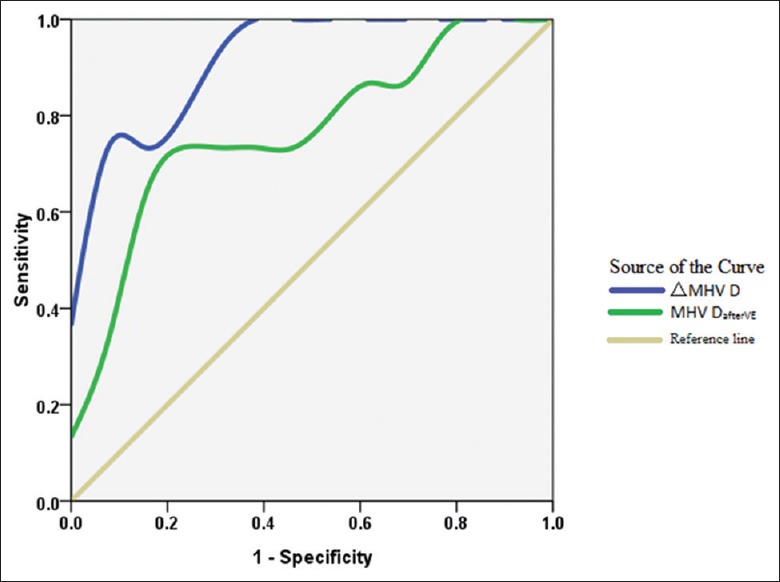
Figure 2.

ROC curve analysis showing the relationship between CO and ΔMHV D. ΔMHV D was able to accurately detect <15% increase in CO on ROC curve analysis. ΔMHV D >21% was associated with no increase in CO during volume expansion, with a sensitivity of 100%, a specificity of 71%, and an AUC of 0.918. MHV DafterVE >31.4 cm/s was associated with no increase in CO during volume expansion, with a sensitivity of 73%, a specificity of 84%, and an AUC of 0.772. CO: Cardiac output; AUC: Area under the curve; ROC: Receiver operating characteristic; MHV: Middle hepatic venous.
