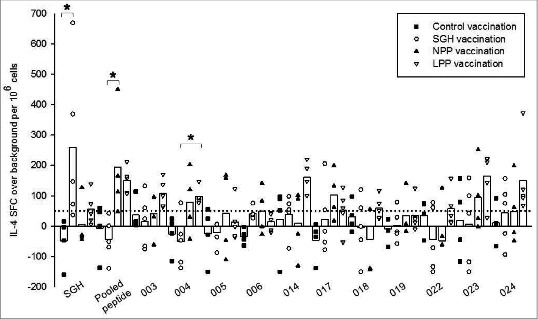
Figure 3.

Antigen-specific HLA DR3 tg mouse IL-4 responses stimulated by tick SGH and immunoinformatics-predicted tick salivary epitopes in control-, SGH-, and peptide-vaccinated mice. Whole SGH, peptide pool and individual epitopes were assayed for T cell reactivity by IL-4 ELISpot assay using splenocytes isolated from vaccinated mice. Data are the mean spot-forming cells (SFC) over background per million splenocytes that secreted cytokines in response to antigen-specific stimulation. Individual subject average responses from experimental vaccination arms are represented as: control immunizations (▪), SGH immunizations (○), naked peptide pool (NPP) immunizations (▴), liposomal peptide pool (LPP) (▿). The mean cytokine responses across all subjects are represented by white bars. The 50 SFC over background per million splenocytes cutoff is denoted by the dotted line. Statistical significance (P < 0.05) is noted by *.
