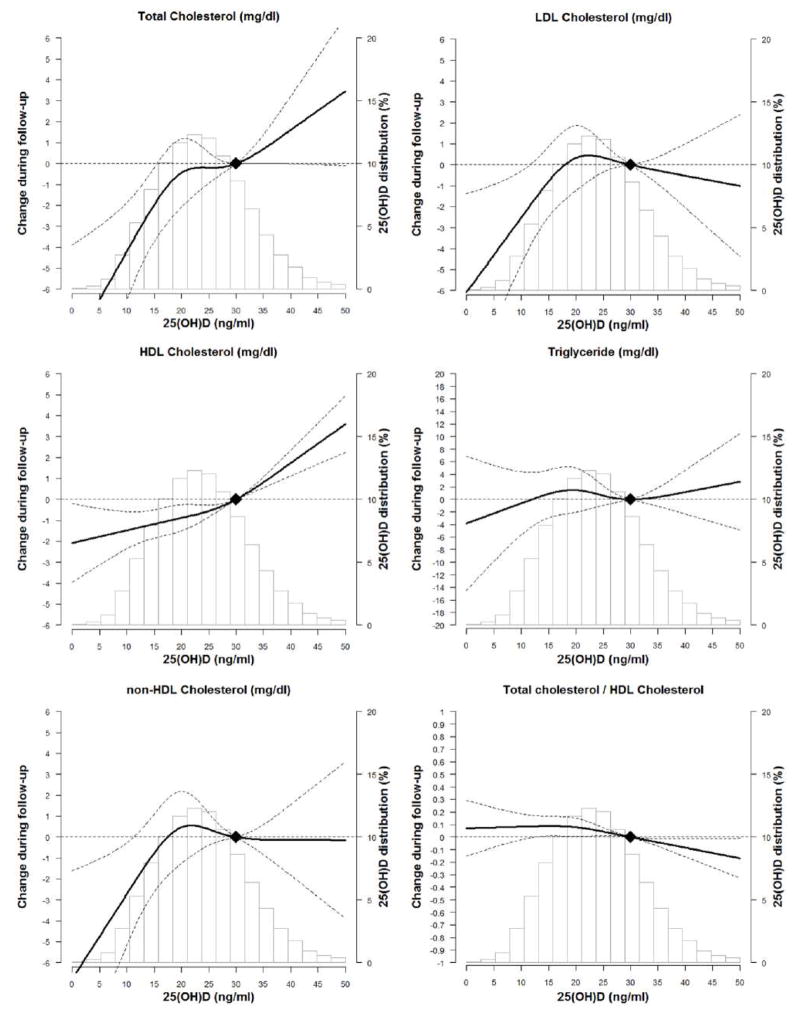
Figure 1. The Association of 25(OH)D at ARIC Visit 2 with Trajectory of Lipids over Time through ARIC Visit 4 Using Adjusted* Restricted Cubic Spline Models (95% confidence intervals).
The solid line represents the change and the dashed lines represents the 95% confidence intervals. Knots at 5th, 35th, 65th, and 95th percentiles. Spline centered at 30 ng/ml. Histogram shows the distribution of 25(OH)D.
*Model is adjusted for age, sex, race/center, time since visit 2, education, BMI, WC, physical activity, smoking, current alcohol, hypertension, diabetes, eGFR and lipid lowering therapy.

