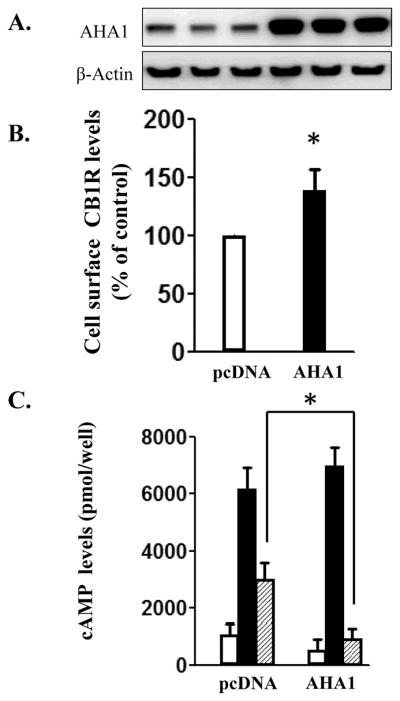
Figure 5. The effects of AHA1 overexpression on the plasma membrane levels and signaling of endogenous CB1R in Neuro-2A cells.

A. AHA-1 levels in control and AHA-1 transfected Neuro-2A cells. The cells were transfected with pcDNA 3.1 or AHA-1 (2.25 μg/well in 6-well plates) and serum starved for 24 h. The lysates and the western blot were performed as described in Fig 2A. B. Cell surface levels of CB1R in Neuro-2A overexpressing cells. Neuro2-A cells were transfected as above and then trypsinized and plated at a density of 50×104 cells/well in 12-well plates. Subsequent procedures to determine plasma membrane CB1R levels were similar to that described for HEK293T cells in Fig 2B. n=9 from three different experiments. * indicates statistically significant differences compared to pcDNA 3.1 transfected cells. C. The effects of CB1R stimulation on cAMP levels in pcDNA 3.1 or AHA-1 transfected Neuro-2A cells. The transfections were made as described and subsequently, the cAMP determinations were conducted as described in the Fig 3. n=12 in each case from three different transfections; * - indicates statistically significant differences between pcDNA 3.1 and AHA1 transfected cells by two-way ANOVA followed by Holm Sidak-test (interaction: F(2,12=30.98, p<0.001).
