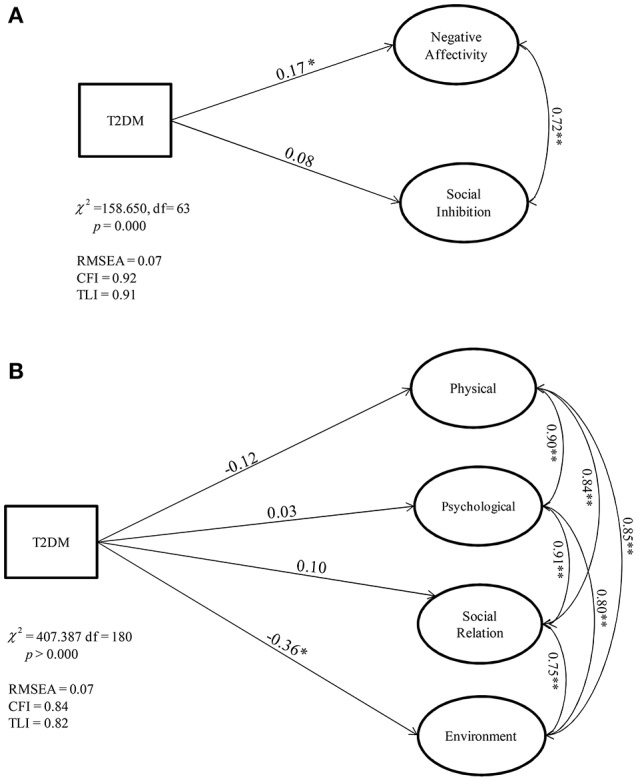
Figure 1.

(A) Negative Affectivity and Social Inhibition dimensions compared between the control (healthy) and clinical group (with T2DM): Structural Model. (B). WHOQOL dimensions compared between the control (healthy) and clinical group (with T2DM): Structural Model. *p < 0.1, **p < 0.05, ***p < 0.01.
