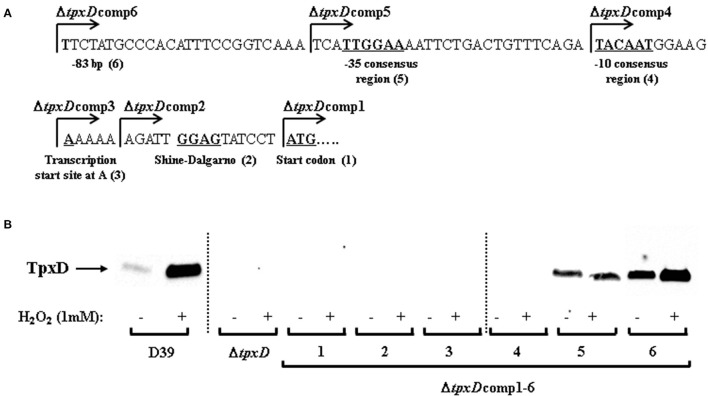
Figure 2.
Identification of tpxD regulatory promoter elements. (A) In silico analysis of tpxD proximal promoter region. Identification of tpxD promoter elements using BPROM algorithm: ATG start codon (1); Shine Dalgarno (2); transcription start site at A (3); −10 and −35 elements of the σ70 promoter (4 and 5, respectively). The first nucleotide included in each of the ΔtpxDcomp mutants (1–6) is indicated by arrow. (B) Influence of tpxD putative regulatory elements on TpxD expression levels under H2O2 stress. TpxD levels, determined by Western blotting, were measured in D39, ΔtpxD and ΔtpxDcomp1-6 (described in Figure 2A). Bacteria were grown anaerobically to OD620 = 0.25 and then challenged with 1 mM H2O2 for 40 min. Separated proteins were electroblotted onto 0.45 μm nitrocellulose membrane, and stained with Ponceau S to ensure equal loading, before incubation with antibodies. Membranes were exposed for long time intervals to ensure the absence of bands in ΔtpxDcomp1-4 and are lined up, as indicated in the figure. Densitometry was performed using ImageJ software.

