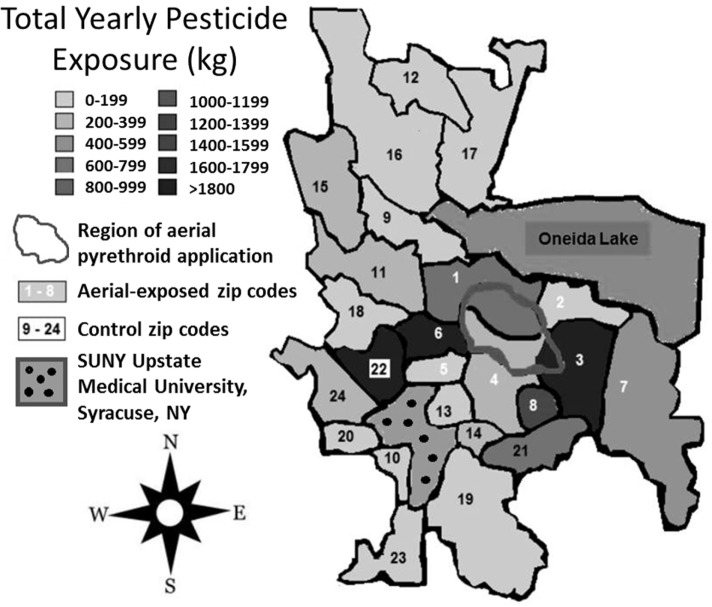
Figure 1.
Regional pesticide exposure. Mean yearly pesticide exposure for each zip code is shown in kilograms. These levels were determined using the most recently available data from the New York State Department of Environmental Conservation Mandated Reporting Database. Total pesticide exposure includes pyrethroids, organophosphates, and other pesticide families regardless of class or application method employed. Aerial-exposed zip codes are numbered 1–8 in white, and control zip codes are numbered 9–24 in black. Note that there was no statistical difference between mean concentration of pesticide exposure between aerial-exposed zip codes (49 kg/km2) and control zip codes (9 kg/km2).

