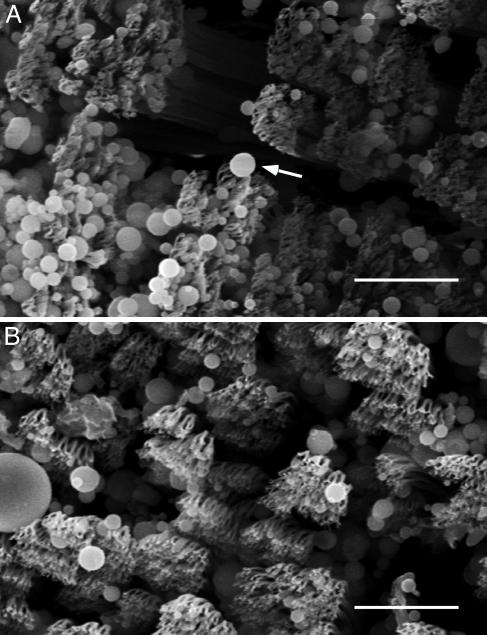
Fig. 4.
Scanning electron micrographs of arrays. (A) Representative array after dirtying with microspheres. Arrow indicates a microsphere adhering to several spatulae. (B) Array from the same animal after five simulated steps. Microspheres are still present, but spatular surfaces are mostly clean. (Scale bars: 10 μm.)

