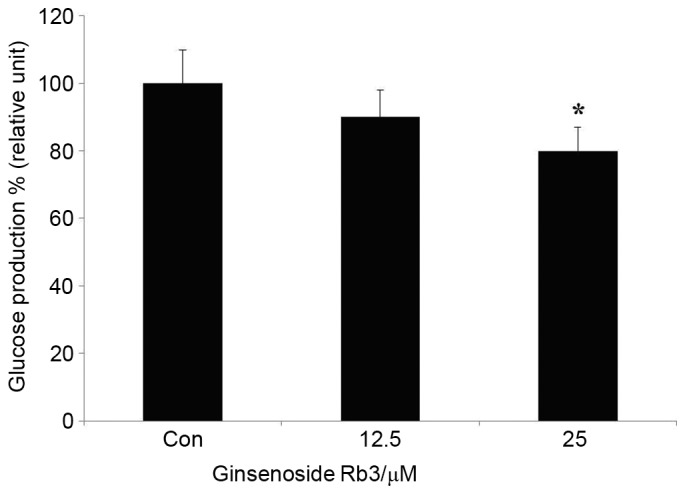
Figure 2.

HepG2 cells were incubated with different concentrations of ginsenoside Rb3 (0, 12.5 and 25 µM), and glucose production from HepG2 cells was determined by a colorimetric glucose oxidase assay. Data are expressed as the mean ± standard error (n=6). *P<0.05 vs. control. Con, control.
