Figure 3.
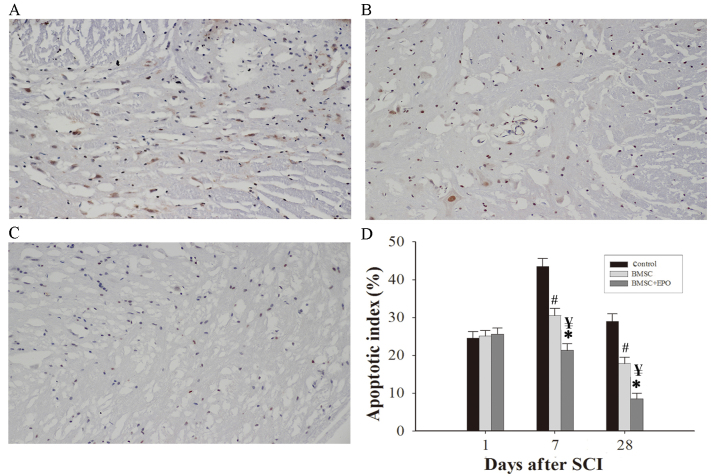
Effect of EPO on the apoptotic index of SCI sites. Images showing apoptosis in the sites of SCI 7 days post-SCI at ×400 magnification in (A) the control, (B) the BMSC treatment group and (C) the BMSCs + EPO group. Apoptotic cells were stained dark brown, normal nuclei were blue. (D) Apoptotic index (percentage of apoptotic cells) in each group following SCI. The number of apoptotic cells was decreased in the BMSCs + EPO group compared with the control and BMSC treatment groups. Results are presented as the mean ± standard deviation. *P<0.01 vs. control group, ¥P<0.05 vs. BMSC group, #P<0.05 vs. control group. SCI, spinal cord injury; BMSC, bone marrow mesenchymal stem cells; EPO, erythropoietin.

