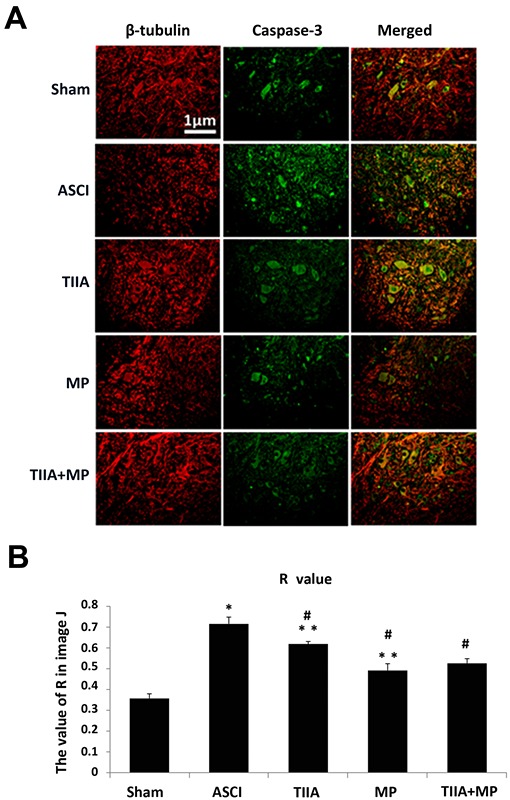
Figure 6.

Immunofluorescence double labeling images and the R value of Mander's overlap coefficient indicate that the immunoreactivity of capase-3 increases in ASCI rats and was reduced following treatment with MP. Scale bar=1 µM. (A) Expression of caspase-3 in the spinal tissues and neurons in vivo was determined by immunoreactivity at day 3 (red, β-III Tubulin and green, caspase-3). (B) Data are presented as mean ± standard error of the mean, n=5 per group. R value represented Mander's overlap coefficient tubulin and caspase-3 in ImageJ analysis software (v2.1.4.7): Ranges between 1 and 0, with 1 indicating high colocalisation (increased levels of caspase-3 in neurons) and 0 indicating low colocalisation (reduced levels of caspase-3 in neurons). *P<0.05 vs. Sham group; #P<0.05 vs. ASCI group; **P>0.05 vs. TIIA + MP group. ASCI, acute spinal cord injury; MP, methylprednisolone; TIIA, tanshinone IIA; TIIA + MP, TIIA and MP combined treatment; Sham, sham-operated, no treatment.
